Whitepaper TimeWalker
tools for visualising huge amounts of log data
draft version, april 2001.
Introduction
Many systems produce huge amounts of time-stamped data (events). Examples are logfiles generated by systemprocesses, time-series generated through network monitoring and transactionlogs generated by (database) applications.
In practice most eventdata is thrown away without having been analysed. The main reasons are:
- saving eventdata requires a lot of resources;
- formats of eventdata are inconsistent and error-prone;
- textual formats of logfiles are inadequate for fast manipulation;
- traditional tools like databases and spreadsheets don't scale for eventdata;
- methods for analysis are labour-intensive;
- tools applying information visualisation for events are not available.
However throwing away eventdata implicates throwing away history. And without history many ways are lost to discover cause-effect relations within (un)wanted or (un)expected system, user or context behaviour. TimeWalker is a tool that makes storage and analysis of eventdata attractive and feasible enough to enable a more careful attitude towards history.
TimeWalker is based on a combination of a smart datamodel and some innovative techniques for information-visualisation along the time-axis. The datamodel unifies arbitrary eventformats for fast aggregations. The visualisation techniques present context and detail simultaneously for data in a range from 40 years down to 10 minutes. The user-interface strategy is focussed on maximizing information-density and minimizing end-user effort.
The implementation is made flexible and portable by using wxPython (version 2.2.5) and C. The first releases of TimeWalker will work for Win32 and Linux.
In the first release the visualisation is intended to work smoothly for about 100000 events in memory. This events however can be aggregated from a much larger dataset of raw events in a preceding batch-process.
Architectural overview
The main components of the architecture are:
- eventmodeller
- The eventmodeller component transforms any collection of time-stamped data in a unified and compact eventlist.
- datastore
- The datastore component facilitates persistence and fast read-access of huge eventlists.
- aggregator
- The aggregator component takes care of in-memory transformation of eventlists into evenlists with aggregation of events in equidistant time-intervals.
- evaluator
- The evaluator component transforms aggregated events with high-level user-specified expressions into numeric result-vectors.
- zoomlens
- The zoomlens component visualizes multiple beams of result-vectors with hierarchical (quarter,week, day, hour,10 min) time-scales.
- calendar+clock
- The calendar+clock component shows the beam-data in the familiar shape of a calendar and a clock.
- treemap
- The treemap component uses a well-known technique from information-visualization to present composite result-values in a kind of hierarchical (rectangular) pie-chart.
- dashboard
- The dashboard component offers instruments for visual-manipulation of the beams and the zoomlens.
- notebook
- The notebook component offers multiple pages with textual table/tree views with all details of configuration-data, metadata and the actual eventdata.
Event model
The eventmodel of TimeWalker was designed with the following properties in mind:
- efficient to store and manipulate large sequences of events;
- suitable for straightforward conversions;
- transparent embedded in Python;
- enabling clean semantics of aggregations and transformations.
An Event represents the basic data-record within TimeWalker. An Event is immutable and is described by a MetaRecord. Alle events described by the same MetaRecord do have the same number of fields. Each Field can be a number, a string or a tuple. The first field is a Timestamp (number of seconds since 1 jan 1970).
A sequence of events can be aggregated in an AggrEvent, which contains an AggrValue (min, max, first, last, sum) as value for the original individual fieldvalues. The fields of an AggrEvent are extended with a dt (time-interval of the aggregation) and a count (number of aggregated events). An AggrEvent can also be extended with fields containing a composite KeyedAggrValue, where an key-expr with a limited value-range specifies a subspectrum of AggrValues .
An EventList is an immutable sequence of events, sorted by their timestamps. All events in an EventList are of the same type (MetaRecord), or are aggrEvents of that type. An EventList is the granule for storage and retrieval to a persistent DataStore. For any access to its contents an EventList is brought into memory as a whole. An EventList is specifically optimized for fast sequential aggregation loops.
A DataStore is used for persistent storage of eventLists and for arbitrary data in Python (used for metadata and configuration properties). Reading from a DataStore is combined with a checksum control.
The conversion from an arbitrary eventdata into a DataStore is kept simple and flexible, but its current performance makes conversion a typical separate batchprocess (improvement is left to the future). However as soon as the data is available from a persistent DataStore all the optimalisations for eventLists will do their impressing work.
Event aggregation
Event aggregation is an automated process that aggregates eventLists into beams to be plotted on a screen. This process has the following steps:
- interval-aggregation
-
With interval-aggregation the period of an EventList is divided in time-intervals (dt) of fixed length. In each interval all events are aggregated into a single AggrEvent.
There is a constraint that an AggrEvent can never be aggregated into a smaller interval. Therefore aggregation results in loss of information when the original eventLists are thrown away.
- value-transformation
-
A value-transformation maps an aggregated EventList into a ResultList. This is accomplished by applying successively an Expression on each AggrEvent, resulting in a ResultVector. Within such an Expression only the fields of the bound AggrEvent and some built-in functions are available.
The rational behind the way aggregation and value-transformation are combined is to enable transparent semantics of EventList combinations and very fast execution. However it is important to be conscious of two important implications of this approach. In the first place expressions consider each AggrEvent as independent of all others. There is no way to make a value in a ResultVector dependent on multiple aggrEvents, like for example is needed for a running total. In the second place by applying expressions on aggregated values some correlations between fields of individual non-aggregated events are lost.
The ambition of TimeWalker is to incorporate all the original data in a suitable representation for interactive visual data-mining based on human capabilities for pattern-recognition. But this ambition can not be fulfilled for huge amounts of data without giving up a number of general-purpose databases mechanisms.
- beam-mapping
-
A beam of height h is the mapping of a sequence of resultVectors on a sequence of pixel-lines of height h and width 1. The x-axis of a beam represents time, the pixel-resolution (dx=1) represents the dt-interval of the aggregation.
The first step of the mapping is to select with a (user-specified) mask the individual values of the ResultVector to be shown. The second step is to scale the values (default is logarithmic). The third step is to apply a plotfunction and a color-scheme to calcalute a pixel-line.
Available plot-functions are spectralPlots, wavePlots (centered histograms) and elevationPlots.
Visualizing hierarchical time-aggregation
One of the key-concepts of TimeWalker is a sliding ZoomLens that shows a bundle of multiple beams with automatic and hierarchical ordered time-scales. The used time-scales are quarters, weeks, days, hours, 10 minutes.
What a bundle discloses in particular for data-mining is trends and coincidences in the occurrences of events. Parallel beams can be used as well for showing different properties of the same eventdata or for showing corresponding properties of different eventdata.
TimeWalker covers a total range of 40 years, starting at 1 jan 1970. The 160 quarters of this whole period are always completely visible as 160 vertical pixel-lines. The remaining width of the mainwindow is used for zooming in into the other more detailed time-scales.
The functionality of a ZoomLens is illustrated in figure 1. In this figure only 2 levels of the zoom-lens are shown.
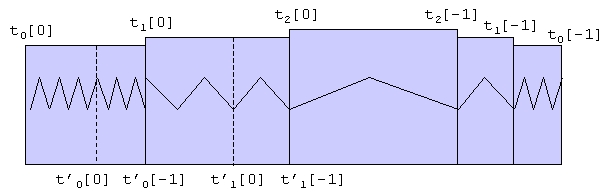
Figure 1.
Each next level (L n+1 ) splits the underlying level (L n ) in a left and a right part, without hiding anything. The total interval of each L n is indicated as t n [0]..t n [-1]. The subinterval of each L n that is magnified in L n+1 is indicated as t' n [0]..t' n [-1]. The rule holds that t' n [-1] = t n+1 [0] for n>0. In other words, one has to look just left of each L n to see which part it magnifies.
Other time-intervals are magnified by dragging the zoom-lens or by starting an animation. Dragging can be done for each L n with n>0, and all visible levels on top of that (L m with m>n) are moving with it.
Visualizing periodicity
Beams are showing data as a linear sequence in time along the horizontal time-axis. While this presentation highlights trends and coincidences, it is harder to notice certain periodic behaviour. Humans do have a strong associative memory for the relations between events and the date or time of their occurrence. Timewalker exploits this capability by adding the familiar shape of a calendar and a clock to the user-interface.
Both Calendar and Clock use small rectangles on which beam-data is mapped. In the calendar (585) rectangles are used for quarters, days and weeks. Days are grouped in months, quarters are grouped in years. The (24h) clock has 48 rectangles. The small rectangles of Calendar and Clock can only contain data of a single (selected)beam.
What one sees in a glance with Calendar and Clock are things like: if and when events occur only at certain monthly periods, certain days or certain hours.
Visualizing hierarchical value-aggregation
The value of a field of an Event can be a path in a tree-structure. It is possible to use such a path as a key for aggregation. The result is considered as a tree for which the technique of a treemap is available. A treemap is a well-known technique from information-visualization to present hierarchical information structures.
A Treemap offers a way of walking through a tree that is consistent with mouse and cursor-keys usage in other components of the mainwindow.
When a Treemap is used for non-hierarchical data it just shows a (rectangular) pie-chart.
User-interface strategy
The metaphor of the user-interface comes close to that of a multifocal looking glass, an instrument to see things better with a minimum of (end-user) effort.
The user-interface is carefully designed for quick pattern-recognition by a regular user. Some consequences of this approach are: each part has a fixed place, there is no scrolling, the information density is high, scaling and coloring is automatic, and there is no static textual information like labels.
For a first impression of the intended look and feel of a preliminary version of the mainwindow is given in figure 2.
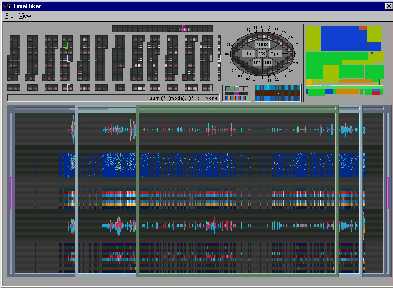
Figure 2.
The multiple views are correlated by a composite indicator (simultaneous visible in all frames) that is connected to mouse-movements. Indication has no further side-effects. Only clicking has side-effects. A single-click selects the location (in time) of the indicator and synchronises the data in all views.
The use of a composite indicators make scale-information along the borders of the a ZoomLens redundant because the indicator shows date/time directly in Calendar/Clock. And the other way round Calendar/Clock can be used to select a specific time in ZoomLens.
Cursor-keys are available as an alternative for mouse-movements in order to obtain indicating accuracy at a pixel-level without problems.
Textual representations in the (graphical) mainwindow are reduced to a single text-field that dynamically shows information about what the mouse indicates.
Apart from the mainwindow and standard help-facilities there is a secondary window for representing a Notebook containing pages with tree/table widgets to browse or manipulate configuration-data, meta-data or raw event-data.
Configuration life-cycles
One way to consider the practical use of TimeWalker is to look at the life-cycles of the main configuration aspects:
- event models
-
To incorporate a new type of eventdata a specific event model has to be specified. This specification has two parts. The first one is a subclass of MetaRecord in Python, describing all the fields of the new type. The second part is a subclass of the ImportExport class, overloading the matchLine method when source-files are line-oriented, or else overloading the readFile method. With these specifications further conversion is automatic.
Because dataformats of events produced by systems or applications tend to be the same for many years, specification of a describing model also has a long life-time.
- data stores
-
A DataStore is filled with new data by importing data with an instance of a suitable ImportExport class, and exporting the result to a DataStore. When details become less relevant, or when the amount of data becomes too massive data can be aggregated before exporting.
The lifetime of a Datastore will mostly depend on general policies for persistent historical data in the organisation.
- value transformations
-
Each value transformation is defined by an Expression in a way similar to what is done in spreadsheets. Also the related problems are similar. An Expression (specified in Python) on itself is not that complicated. However making the right choices requires both real domain knowledge as well as experience with the impacts for visual discoveries.
It is likely that a number of well chosen expressions will be reused for default overviews. But there will also remain a continuous need for new expressions to cover new experiences and insights.
- beam mappings
-
Beam mappings are simpler and more straightforward than value transformations. They are designed to be changed by direct manipulation to support the user with immediate response on the effect of setting visual parameters.
It is to be expected that beam-mappings will be changed in each user-session.
- viewing states
-
In the interactive process of setting parameters, selecting data, browsing and zooming an end-user will see things to be analysed later or to be presented to colleagues. Therefore a mechanism is offered to save and restore a complete snapshot of a viewing state.
Complementary to the fact that viewing states represent the most volatile configuration aspects, an end-user is able to save or restore persistent snapshots at random moments.
- exports to other tools
-
The functionality of TimeWalker offers mainly visual support for hypotheses about (un)expected correlations of eventdata. The finding of further proves for hypotheses if left to other tools. There is a facility is to export data (from a table-view) into a database or spreadsheet format.
Exports can be done at any moment after data has been read from a DataStore.
In summary, the way of working with TimeWalker has some similarities with the way of working with a spreadheet. Main differences are that TimeWalker is able to handle huge amounts of eventdata, and that the user-interface is specialized and tuned for the discovery (by human perception) of hypotheses about any behaviour that correlates with time.
References
| [1] | S.K. Card, "Reading in Information Visualization, Using Vision to Think", Morgen Kaufmann, 1999. |
|---|---|
| [2] | J. Raskin, "The Humane Interface", Addison Wesley, 2000. |
| [3] | D.M. Beazley, "Python Essential Reference", New Riders, 2000. |
| [4] | M. Hammond, A. Robinson, "Python Programming on Win32", O'Reilly, 2000. |
| [5] | Th.F. de Ridder, "Informatie Visualisatie als Beheerinstrument", IT beheer jaarboek 1999. |